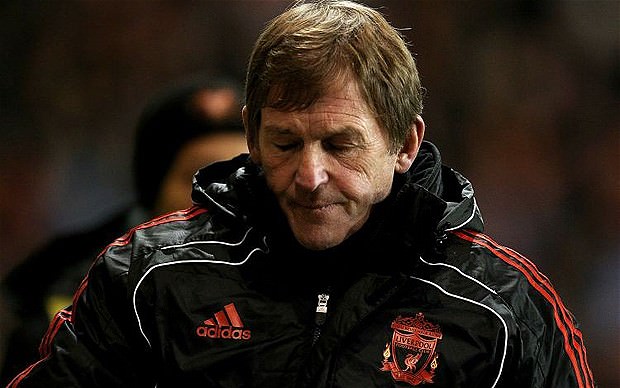
Kenny Vs Hodgson 2010/11
 The table on the right shows that Roy Hodgson struggled to get his side to score goals but his goals per game ratio is actually better than Kenny’s this season! So far Kenny’s Liverpool of 2011/12 are averaging 1.15 goals per game (rounded up to 1.2 in an image later). A worrying stat, anyway we’re supposed to be comparing last season so let’s get back to that.
As you can see, Kenny’s Liverpool of 2010/11 outperformed Hodgson’s Liverpool comprehensively. Averaging almost two goals per game and improving the shot accuracy by 12%. A key stat is the improvement of chance conversion from 11% to 16%. Suarez’s introduction last season got the side to improve its creativity and fluidity as he struck a chord with Kuyt and Maxi Rodriguez. The side playing some super football at times especially at home to United, Newcastle & Birmingham and then away at Fulham.
 How we hope for a rise by 5% in chance conversion from now until the end of the season! However that is unlikely. Let’s also have a look at the other parts of the team’s performance against last season. There’s a marked improvement in shots per game over last year however only a slight improvement in shots on target. The major change has also come in the shots off target per game. The two shots per game that Liverpool have improved on from last year are going off target. The improvement in shots per game is therefore nullified by the fact that we can’t seem to keep the shots on target. Again accuracy is one of our major problems this season.
More on following page: Kenny 10/11 Vs Kenny 11/12

