
One of the key breakthroughs recently in football’s fanalytic community has been the development of shots models that look at quality of chances that teams or players have and their ability to finish those chances. There has been some very interesting work carried out by @colinttrainor (like this), @11tegen11 (like this), and @footballfactman (like this), where they have put in a significant amount of work to look at where shots are taken from and what the conversion rates are for shots from those areas.
One of the issues with simply using shot location, as discussed by @mixedknuts (here), is that it does not take into account the positioning of the defenders. For instance a player may take a shot in the central area of the box but have 4 defenders and the keeper between him and the goal, so the probability of a goal would be low; equally a player may break an offside trap and have the ball outside the area but be 1 on 1 with the keeper, so the likelihood of scoring would be quite high. So I had the idea of creating a similar model, but using the Clear Cut Chance (CCCs) data that we have here at EPLIndex.
Using 3 seasons worth of data, I have created a benchmark team that can be used to compare the performance of all the Premier League teams against in terms of the following metrics, the amount of shots they take, the quality of chances they create, and their ability to finish those chances.
Rate of Attack
This is very simply the amount of shots a team takes, and can be measured on a per game (SpG) or per season (SpS) basis. Yes, I know that not all attacks end with a shot and I am basically just using total shots, but I wanted the model to have a ‘racey’ acronym, so Rate of Attack it is.
On average, each team takes about 14.5 SpG, or about 550 SpS. Between 9-10% of all shots end up with a goal, and this has been found to be consistent season upon season and across different leagues. For those that don’t know, this is called the Reep Ratio, after an amateur statistician named Charles Reep, who looked at various stats, including the conversion rate of shots, in the 1950s.
Creative Efficiency (%CCC)
This is a measure of the creativity of the team and quality of chances they have, and this is where I am using CCCs. A CCC is one of Opta’s few subjective statistics, and whilst a full description is not given, a brief description is given by Opta in their Event Definitions under Big Chance (here)
[quote]A situation where a player should reasonably be expected to score usually in a one-on-one scenario or from very close range.[/quote]
Creative Efficiency (%CCC) is measured as a proportion of Clear Cut Chances to Total Shots. A team with a high %CCC will, over time, create chances that are easier to score from than the average team. Whilst CCCs make up only about 13% of all shots in the Premier League, they are vitally important, as for each of the last 3 seasons, around 52% of all goals have been scored from a CCC. It should be noted that CCCs include penalties, and whilst I did consider removing them from the analysis as they have their own average conversion rate, I decided to include them for a few reasons, there will be some open play CCCs that will be easier to score from than a penalty, I also think that teams that attack more or are more creative will tend to get more penalties, at least over the long term, and that should be included in their Creative Efficiency, and finally because I want to keep the model simple and with as few adjustments as possible.
Obviously when you multiply a team’s Rate of Attack by their %CCC, you will get the number of shots which are CCCs. The remaining shots will be what I will call, as I can’t think of a more appropriate term, Normal Chances. The two types of shot have their own average conversion rate, and the model analyses the quality of finishing of both types of chance by comparing the goal expectancy (number of chances multiplied by the average conversion rate) to actual goals scored for each type of chance.
CCC Conversion
To give an indication of the average difficulty of a CCC compared to the average shot, it is on average about 4x easier to score a CCC as they have an average conversion rate of just under 38%. It should be remembered though that there is a large range in the probability of a CCC being scored, Sam Green of Opta has said (here) he considers the base probability to start at about 20% and it of course goes up to 100%.
Normal Chance Conversion
The average conversion rate of Normal Chances is slightly above 5%. The reason why I won’t classify them along the lines of a ‘difficult’ chance is that with the goal expectancy range for individual shots being between 0% and 20%, anything with an expectancy above 10% will still be easier than average.
The Numbers
Here are the hard numbers I have collected for the past 3 seasons.
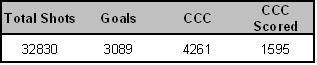
And these are the benchmark ratios/rates that I have either mentioned or will be using for the theoretical average team.

So, how did each team perform last season? In terms of number of shots, Liverpool lead the way by far with 740 shots over the season, 59 more than Tottenham took, the next best team, and not far off double the amount of shots that Stoke had.
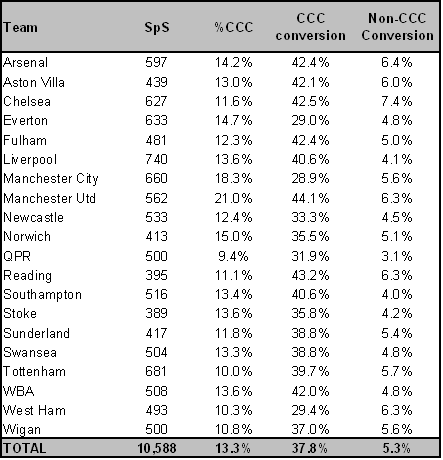
It may not come as much of a surprise to see that Manchester United had the best %CCC, with 21% of the efforts being from a CCC, compared to 18.3% for 2nd placed Manchester City. To put this difference into perspective, whilst Man City took 98 more shots than Man Utd, they only had 3 more CCCs. Liverpool had 178 more shots, but with a %CCC of ‘only’ 13.6% (still above average) had 17 less CCCs.
In terms of shot conversion, the team with the best conversion rate for CCCs was, yes you’ve guessed it, the team who scored the most goals, Manchester United with 44.1% of them scored. The team with the worst conversion of CCCs was, yes you’ve guessed it, the team who scored the least…oh, it was actually Manchester City, with only 28.9%, I didn’t guess it either. So, City had 3 more CCCs, but scored 17 fewer CCCs, a significant amount.
The team with the best conversion rate of Non-CCCs was Chelsea at 7.4% leading to goals, and this time we do find the expected QPR at the bottom of the pile with only 3.1%.
I’ll admit that the table above is a little hard to read though, we’ve got different units and magnitudes of measurement and its hard to see how well each team is doing overall, so lets add some context and measure each teams performance as the percentage change from our benchmark team.
Now things become a bit clearer. We can see that despite only taking 3% more shots more than the benchmark, Manchester United’s %CCC was a whopping 62% higher than average, which goes some way to explaining why their total shot conversion was so much stronger than everyone else at 14.2%. However they also significantly outperformed both conversion rate metrics, meaning they scored almost 13 goals more than expected if they had average finishing. If they had scored at average rates, their total conversion rate would still have been the highest in the league though at a touch under 12%.

Only 2 teams managed to beat the benchmark for all 4 metrics, Man Utd and Arsenal. Of the other top teams, Chelsea and Tottenham had a relatively poor %CCC, Man City were poor at converting their CCCs, Liverpool were poor at converting their Non-CCCs, and Everton were poor at converting both types of chances.
At the other end of the table, only 2 teams performed worse on all 4 metrics compared to the benchmark as well, unsurprisingly QPR, with the other team being Newcastle. Reading were very good at finishing their chances, its just that they struggled to create any.
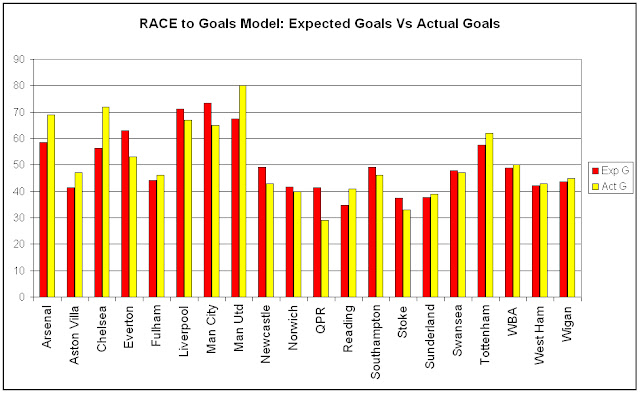
So what does this all look like when we convert these metrics to expected goals and how did the teams compare? There were 3 big out-performers, Chelsea (15.7 goals above expected), Man Utd (+12.6), and Arsenal (+10.4) whilst there was 2 big under-performers in QPR (-12.3) and Everton (-10.1). For those of you who are into your ‘proper’ statistics, I’ve calculated the Mean Absolute Percentage Error for the model over the last 3 seasons as 10% and the Root Mean Squared Error as 7 goals.
I’ll finish with how my model differs from those I’ve mentioned which look at shot location. I’ll start with the weaknesses. The first is that my model is far less granular as I have lumped the 87% of all shots that are Non-CCCs with the same goal expectancy, which means that the type of analysis that I can do with my model probably can’t go quite as deep as the others. There is an element of trust in Opta that they are consistent when collecting the CCC data as it is subjective, particularly as we do not know their precise definition, although having read this (here), I think its fair to assume they are consistent. And because we do not know exactly how Opta define CCC, I think it will be very difficult to see how or if the metrics change depending on the Game state as the info of when a CCC occurred is not available. Whilst on average there are just under 4 CCCs per game, so it might be possible by watching the highlights or reading the match reports to figure it out for most games, in some cases however, as shown by @analysesport (here).
The positives are that it is very easy to collect and analyse the data, you only need the number of games played by a team, their total shots and the number of CCCs they’ve had to be able to estimate the number of goals they should have scored. And, as mentioned, this model at least separates out those chances where the defenders are not making a significant difference to the difficulty of a goal being scored, and whilst these only make up 13% of the chances, they do make up 52% of the goals.
In future posts I will look at how teams performed against these metrics from a defensive point of view as well as how useful these metrics might be in predicting future performance.