After collecting all the attacking data from the previous three full seasons and all the matches this campaign (before the weekend), we can now look at the best teams when it comes to shots on target, shots inside the box, big chances created and goal conversion.

 by Daniel Rhodes using data from EPL Index and Stats Zone.)
Big Chances:
The definition, which is important to remember because of the subjective nature of the metric, is:
A situation where a player should reasonably be expected to score usually in a one-on-one scenario or from very close range.

I’ve included the top six teams from the Premier League in terms of points won over the time we’re assessing.
Although the metric is subjective, creating ‘clear cut’ (as they were known in the good old days) chances is crucial to not only qualifying for the top four, but also winning the league. Man City are the best, as well as the most consistent, alongside Arsenal. The last time Man Utd won the league, they also created the most big chances; in fact, the figure of 2.97 per game is the highest figure since the data started being collected.
Top Four Benchmarks:

If you look at the attacking benchmarks required to finish in the top four, you’ll see how the Red Devils fell out of the top four last season under David Moyes: a drop off in total shots (nearly 3 shots a game away from the average), shots inside the box and perhaps most importantly, fewer than two big chances a game (1.92).
Individual Benchmarks:
- Goals scored: 81
- Goals in the box: 66
- Goals outside the box: 15
- Shots inside the box: 11
- Big chances: 100 per season, or 2.65 pg
The eagle-eyed amongst you will have noticed the team at the bottom of the table above, who currently sit third in the Premier League, and yet still post poor numbers in comparison to the rest of the teams in the Champions League spots (oh, and they have a world class goalkeeper and a deep-lying target man, but that’s for another article!). To get a true reflection of what a team needs to do to finish in the top four, it is important to measure the differences between quality chances being created and those conceded. That is when you find the balance between attack and defence. But again, this article is focusing on attacking threat, so we’ll move on.
Shots Inside the Box

Although fairly self-explanatory in terms of the definition, the number of attempts you’re taking inside the penalty area is another area of value when assessing a teams’ attacking threat. Not only does it illustrate how often you’re going forward, but it also highlights the teams decision-making, because if you work a chance inside the area, then you have – logically and statistically – a better chance of converting the shot:

This diagram from Paul Riley shows the number of shots it takes to score a goal from each section of the pitch taken over multiple league seasons.
Again it is Man City who show the most consistency and threat, in fact, they occupy the top four slots in the top four benchmarks table. And are the only team to register more than 12 shots inside the box per game over the course of a season. They’re by far the best attacking side in the league, probably followed closely by Arsenal and Man Utd, and occasionally Liverpool. Chelsea’s strength, undoubtedly since Ancelotti left, has been preventing chances rather than creating a bucketload, although they have improved significantly this season across the board.
Goal Conversion
This can be called a number of different things, including shot conversion, chance conversion and all sorts of other words followed by conversion! Nevertheless, if you click the heading above, you’ll see that the equation is simple: total goals divided by total attempts on goal. Here’s the figures:

And the winners are… Man Utd. The absolute kings of clinical finishing. While Liverpool and Spurs regularly drop below the league average of 9% (not the top four ave, which is 12%), Van Gaal’s, Moyes’ and Ferguson’s squads do the opposite. They finish their chances better than anyone else; only Arsenal and Man City can compare, and even then never to the same degree of over-achievement as the Red Devils.
Is this by design? Can you plan and prepare to do this? Can a manager set his team up tactically to finish off more chances than average? Do you just need three or four quality strikers? One or two players with the eye for a killer through-ball? Or is there an element of luck? My guess is that it’s a combination of all of the above.
Conclusion:
Hope you’ve enjoyed this brief look at the attacking threat of the best sides in the Premier League over the past four seasons.
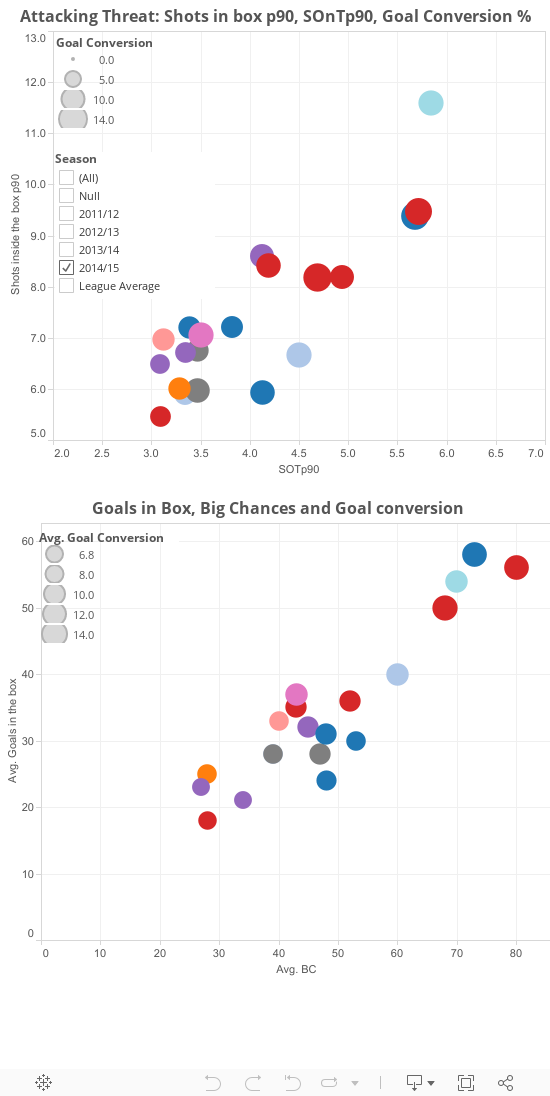
If you did, you’ll enjoy the interactive Tableau dashboard below, where you can play about with the data yourselves.