

Adoption of the Football Data Analytics in the EPL
The adoption of data analytics by major leagues, such as the English Premier League (EPL), has revolutionized football. It is a transition from the traditional stats like goals and assists to sophisticated metrics like expected goals or expected assists. The Athletic’s research showed that approximately 75% of EPL clubs use specialized data analysts, including top clubs like Manchester City and Liverpool, averaging 14 analysis-based staff members.
These analysts use technologies like optical tracking systems and wearable devices to generate millions of data points per match, covering every pass, tackle, and movement. All this data is transferred to football-centric online platforms that deliver visually stunning graphics and metrics for every aspect related to past, current, and upcoming EPL matches.
Unique Football Metrics Used for the EPL Analysis
The EPL analysts heavily rely on a range of unique metrics to dissect the player’s performance. These metrics offer granular insights into player contributions, team dynamics, and tactical trends.

Expected Goals (xG) and Expected Assists (xA)
Expected goals (xG) metrics measure the likelihood of a shot resulting in a goal. This metric is based on such factors as the shot distance, angle, and type (e.g., header, volley). xG models assign a penalty a 0.76 probability of scoring, derived from thousands of historical shots. Expected assists (xA) similarly quantifies the probability of a pass leading to a goal. For example, you can check such metrics using the services of Predixly EPL live stats, visual graphs, real-time updates, and other soccer stats.
These metrics are basic for EPL analysts. Clubs use xG to assess whether a team’s goals align with their chances created. While xA highlights the performance of players like Kevin De Bruyne. His precise passing consistently creates high-value opportunities.
Expected Threat (xT)
Expected Threat (xT) evaluates the potential danger of a player’s actions, such as passes or carries, in advancing the ball to goal-scoring positions. For example, Manchester City uses xT to refine their pressing system. They identify optimal pitch areas for creating chances. Unlike xG, which focuses on shots, xT captures the broader impact of build-up play. Though it can be invaluable for analyzing midfielders like Declan Rice.
Pressing Intensity and PPDA
Pressing intensity measures how aggressively a team presses opponents, while Passes Per Defensive Action (PPDA) quantifies the number of passes an opponent completes before a defensive action (e.g., tackle, interception). For example, Liverpool’s “gegenpressing” under Jürgen Klopp relies on low PPDA values. These metrics help coaches like Pep Guardiola adjust pressing triggers in real time, optimizing defensive structures.
Team Centroids and Pitch Control
Team centroids represent the geometric center of a team’s player positions, revealing spatial control. Clubs use the innovative centroid analysis to show how possession correlates with pitch coverage, with attacking teams occupying larger areas. Pitch control models (often powered by AI) calculate the probability of a team controlling specific pitch zones. It helps to improve tactical planning. Arsenal’s analysts, for example, use these metrics to study opponents’ formations.
Possession Value and Sequences
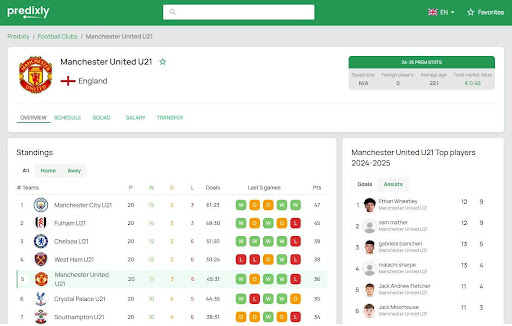
Possession value quantifies the impact of each possession sequence, assessing how actions like passes or dribbles increase scoring probability. The sequence data tracks multi-pass moves, revealing patterns in teams like Brighton, who excel in structured build-up play. This metric helps analysts identify players who initiate or sustain dangerous sequences, such as Bruno Fernandes at Manchester United.
Source – Predixly.com
Defensive Stability and Off-Ball Metrics
Defensive stability metrics, like interceptions and clearances, measure a team’s ability to thwart attacks. Off-ball metrics, such as a player’s runs or positioning, are critical for evaluating work rate. For example, Liverpool’s recruitment of Roberto Firmino was driven by his off-ball pressing metrics and complemented Klopp’s system. These stats are vital for defenders like Virgil van Dijk, whose positioning minimizes opponent threats.
Set-Piece Efficiency
Set pieces (corners, free kicks, penalties) are high-value moments in the EPL. For instance, Manchester City hired specialist set-piece analysts to optimize routines, leading to above-average goal returns from corners. Football metrics like set-piece xG and conversion rates help coaches design targeted strategies, as seen with Brentford’s success under Thomas Frank.
Physical and Fatigue Metrics
Wearable devices track physical metrics like distance covered, sprints, and top speed, while fatigue metrics monitor player workload. For example, Liverpool uses wearables to manage player fitness, ensuring stars like Salah play over 80% of match minutes without burnout. These metrics inform rotation strategies, especially during congested fixture schedules.
How Does Predixly Deliver EPL Stats?
Predixly.com, powered by TheSports.com, is a leading platform for delivering real-time EPL stats to fans, coaches, and players. With the ability to cover 1,500+ tournaments, including the EPL, with data from 1998, Predixly offers a user-friendly experience.
Source – Predixly.com
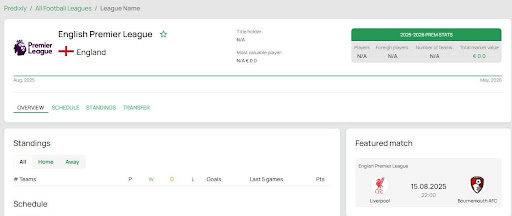
This is how EPL fans can benefit when using Predixly’s unique features:
- Real-Time Match Analytics. Predixly delivers live EPL stats with a 1-3 second delay to ensure users stay in sync with matches;
- Event Timelines. Color-coded timestamps for goals, cards, substitutions, and penalties. Fans can capture the unique moments like Harry Kane’s last-minute strikes. For example, during a Manchester United vs. Arsenal match, fans could see a penalty’s timestamp and outcome instantly;
- Activity Graphs. Visualize attacks, dangerous attacks, and possession by the minute. You can see the momentum shifts, such as Liverpool’s second-half surges. These graphs help coaches adjust tactics mid-game.
- Advanced Metrics. Live xG, xA, PPDA, and possession data allow players to target weaknesses, like exploiting a full-back’s low tackle success rate;
- Text Broadcasts. Minute-by-minute updates of fouls, offsides, and controversies provide a narrative alongside numerical data;
- Squad Breakdown. Players listed by position, with metrics like average age, market value, and xT, e.g., analyzing Manchester City’s midfield depth;
- Goal Distribution. Goals scored/conceded by time intervals, revealing patterns like Tottenham’s late-game vulnerabilities;
- Form Heatmap. Color-coded results (W/D/L) for the last five matches, helping fans predict outcomes for teams like Newcastle United;
- Set-Piece Metrics. Conversion rates and xG from corners, aiding coaches in designing routines, as Brentford does effectively;
- Head-to-Head (H2H) Analytics. Match history between teams, e.g., Liverpool vs. Manchester United, with wins, draws, and goals, aiding pre-match analysis;
- Season Summaries. Points, goal differences, and rankings, allowing fans to compare Arsenal’s 2024/2025 season to past campaigns;
- Champions History. Records of EPL winners, highlighting dominant teams like Manchester City.
Player Performance Insights – The Main Perk of Predixly
Predixly’s player profiles provide detailed EPL metrics, tailored for fans, coaches, and players. Thanks to these metrics posted on the official Predixly website, the EPL fans can explore stars like Mohamed Salah’s xG trends. At the same time, coaches can use defensive metrics to scout players like Rúben Dias.
| Metric | Implementation |
| Match History | Lists all EPL matches with goals, assists, xG, xA, and ratings, e.g., Erling Haaland’s 2024/2025 season stats |
| Season Summary | Goals, assists, tackles, and PPDA, filterable by match or opponent, e.g., analyzing Cole Palmer’s creativity at Chelsea |
| Physical Metrics | Distance covered, sprints, and fatigue data, helping coaches manage rotations for players like Bukayo Saka |
| Career Tracking | Transfer history and contract details, showing a player’s market value trajectory, e.g., Jude Bellingham’s rise |
Conclusion
Unique football metrics like xG, xA, xT, and PPDA have transformed the approaches to EPL analysis, with deep insights into player and team performance. The metrics that have roots from scientific methodologies help coaches, players, and analysts to make data-driven decisions. While fans use them to deepen their engagement. Predixly.com delivers these stats in real time, with intuitive tools like event timelines, player profiles, and smart filters. Thanks to such platforms, the EPL’s stats and analytics became available for every fan, player, and coach.

