
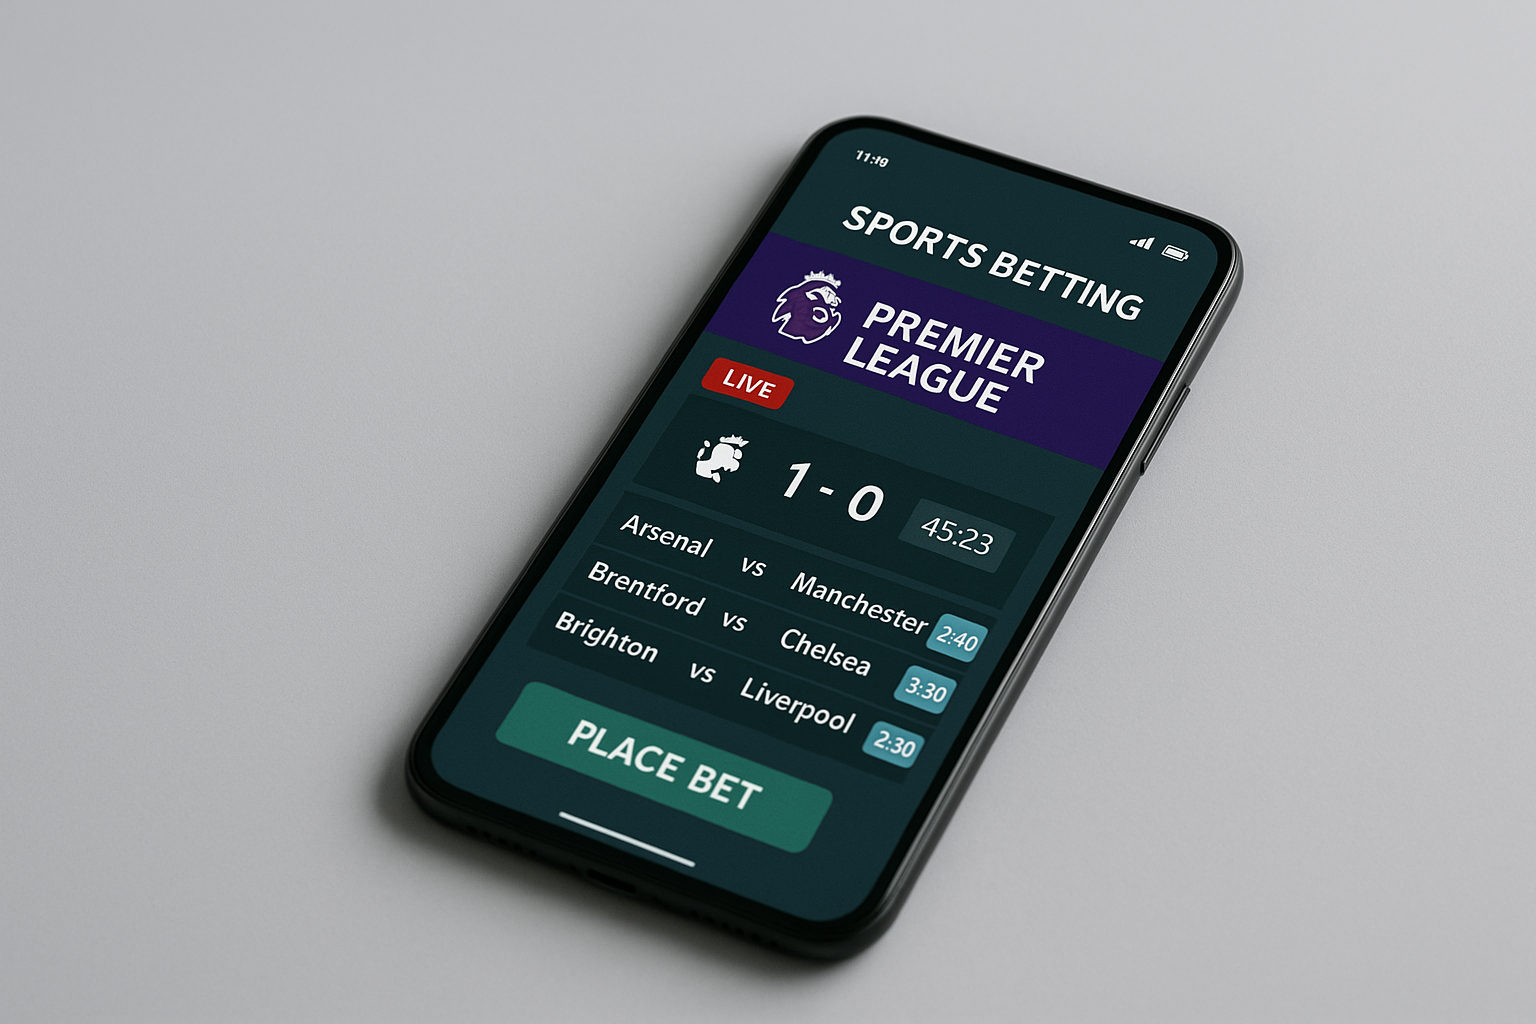
The days of placing a wager on a football match based solely on gut instinct or league position are rapidly fading. Modern handicapping requires a sophisticated approach that leverages the vast amount of data now available to the public. For Premier League enthusiasts, the difference between a casual flutter and a strategic investment often lies in the ability to interpret complex datasets that go beyond the basic win-loss columns.
As the industry evolves, the sheer volume of available information can be overwhelming for the uninitiated. The competitive nature of online betting allows punters to access detailed statistical databases and sophisticated analytical tools that were once the exclusive domain of professional syndicates. Understanding how to filter this noise and focus on predictive metrics is essential for anyone looking to gain a genuine edge over the bookmakers in the long term.
Decoding Expected Goals for Better Match Predictions
Expected Goals (xG) has transitioned from a niche statistic to a fundamental component of football analysis, yet many bettors still fail to utilise it correctly. At its core, xG measures the quality of a goalscoring chance based on variables such as shot angle, distance from goal, and the type of assist. While the final scoreline tells you what happened, xG tells you what should have happened based on the balance of play. This distinction is critical for identifying teams that are overperforming or underperforming relative to their actual output.
When analysing a team like Arsenal, for example, simple points totals often align with underlying metrics, but not always. Current data indicates that Arsenal FC has the highest points per match in the 2025/26 Premier League season at 2.21, a statistic that validates their dominance on the pitch. However, for a bettor, the value lies in spotting when a team’s points total is high despite a low xG, suggesting their luck may soon run out. Conversely, a team creating high xG but failing to score is often a prime candidate for a positive regression, making them a smart bet in upcoming fixtures before the market adjusts.
It is also vital to separate offensive xG from defensive xGA (Expected Goals Against). A team might be securing narrow wins, but if their xGA suggests they are conceding a high volume of quality chances, they are statistically fragile. Smart wagering involves betting against these fragile defences before the inevitable correction occurs. By consistently comparing a team’s actual goal difference with their expected goal difference, you can build a power rating system that is far more predictive than the official league table.
Analyzing Player Heatmaps for Prop Market Success
The explosion of player prop markets—wagering on individual shots, tackles, or passes—has created new opportunities for astute observers. To exploit these markets, one cannot rely simply on a player’s position as listed on the team sheet. Player heatmaps provide a visual representation of where a footballer actually touches the ball and spends the majority of their time during a match. This spatial data is invaluable when assessing whether a specific player is likely to meet a statistical threshold set by the bookmakers.
Consider the role of modern full-backs. In some systems, a full-back may essentially operate as a winger, spending most of their time in the opponent’s final third. A heatmap will confirm this high positioning, making them an excellent value option for “shots on target” or “assist” markets, often at much longer odds than traditional forwards. Conversely, a midfielder who is ostensibly an attacker but whose heatmap shows them dropping deep to collect the ball is a poor candidate for goalscoring props, regardless of their reputation.
Furthermore, heatmaps can help predict defensive engagements for “tackles” or “fouls” markets. If a team’s heatmap shows they funnel opposition attacks down the left flank, the right-back facing that pressure is statistically more likely to accumulate tackles and interceptions. By overlaying the attacking heatmap of one team with the defensive heatmap of their opponent, you can identify tactical mismatches that lead to high-volume defensive actions, offering a clear edge in the props sector.
Identifying Value Through Digital Market Comparisons
Finding the right selection is only half the battle; securing the best price is equally important for long-term profitability. The digital landscape allows for instant comparison across dozens of platforms, highlighting discrepancies in how different algorithms assess the same event. This is particularly true in “totals” markets, where a slight variance in the expected goal count can offer significant value.
Understanding the league-wide scoring environment provides a baseline for these comparisons. For instance, the average goals per game in the 2024/2025 English Premier League season was 2.9, indicating a trend toward high-scoring affairs. When bookmakers set a standard line at 2.5 goals, knowing that the historical average hovers near 3.0 gives the “Over” bettor a statistical starting point. However, blind betting on averages is dangerous; the edge comes from finding bookmakers who have been slow to adjust their lines for specific matchups that deviate from this mean.
Advanced bettors also utilise closing line value (CLV) to measure the strength of their wagers. If you consistently bet on a team at odds of 2.10, and the market closes at 1.90, you have beaten the market, regardless of the match result. Over time, beating the closing line is a strong indicator of a winning strategy. By using odds comparison tools to shop for these discrepancies early in the week, bettors can lock in prices that represent true value before the weight of public money forces the lines to sharpen.
Evaluating Referee Statistics for Card Market Edges
Referee assignments are often an afterthought for casual fans, but for data-driven bettors, they are a primary variable. Each official in the Premier League has a distinct personality and threshold for disciplinary action. Some referees manage games with a light touch, preferring to keep cards in their pockets to let the game flow, while others adhere strictly to the letter of the law, booking players for minor infractions early in the contest.
Analysing referee statistics involves looking at “cards per game” averages, but also digging deeper into their split between home and away bias. Certain officials may statistically favour the home crowd’s appeals, while others overcompensate to appear neutral. Additionally, understanding a referee’s relationship with VAR is crucial. Officials who frequently rely on video review may prolong matches, inadvertently affecting “injury time” markets or increasing the likelihood of penalties being awarded for marginal fouls that would otherwise be ignored.
The context of the match combined with the referee’s profile creates the perfect storm for card betting. A local derby featuring two aggressive teams is already a high-card candidate, but assigning a strict authoritarian referee to such a fixture exponentially increases the probability of a red card or high booking points. By cross-referencing team disciplinary records with the appointed official’s history, you can predict the “temperature” of a match far more accurately than the odds suggest.
Tracking Squad Rotation Impacts on Weekend Odds
The modern Premier League schedule is grueling, and manager rotation policies have become a decisive factor in match outcomes. As European competitions expand and domestic cup fixtures pile up, the “best XI” rarely plays every weekend. Anticipating which key players will be rested is a skill that separates professional handicappers from the rest. This is particularly relevant for away fixtures, where squad depth is tested most severely.
Historical data provides context on how difficult it is to secure results on the road, with away wins accounting for 35% of matches in the 2024/2025 English Premier League season. When a top team rotates their squad for an away game following a mid-week Champions League tie, that 35% probability can drop significantly, yet the odds often remain priced on the club’s reputation rather than the specific lineup. Identifying these spots where a favourite is vulnerable due to fatigue or rotation allows bettors to find value in “Double Chance” markets or Asian Handicap underdogs.
Ultimately, successful wagering in 2026 requires a holistic view of squad management. Tracking minutes played, injury reports, and press conference comments helps build a predictive model for the starting lineup. If you can accurately predict that a star striker will be benched before the official team sheets are released, you can take a position on the “Under” or the opponent’s handicap at a price that will vanish once the news becomes public. In the high-stakes environment of Premier League betting, information is the currency, and timing is everything.

